Appearance
Website updates - new homepage, real-time visualization, and more
April 24, 2026
We have made a round of updates to the Open Science Platform website, bringing a redesigned homepage and a new visualization of our real-time data engine.
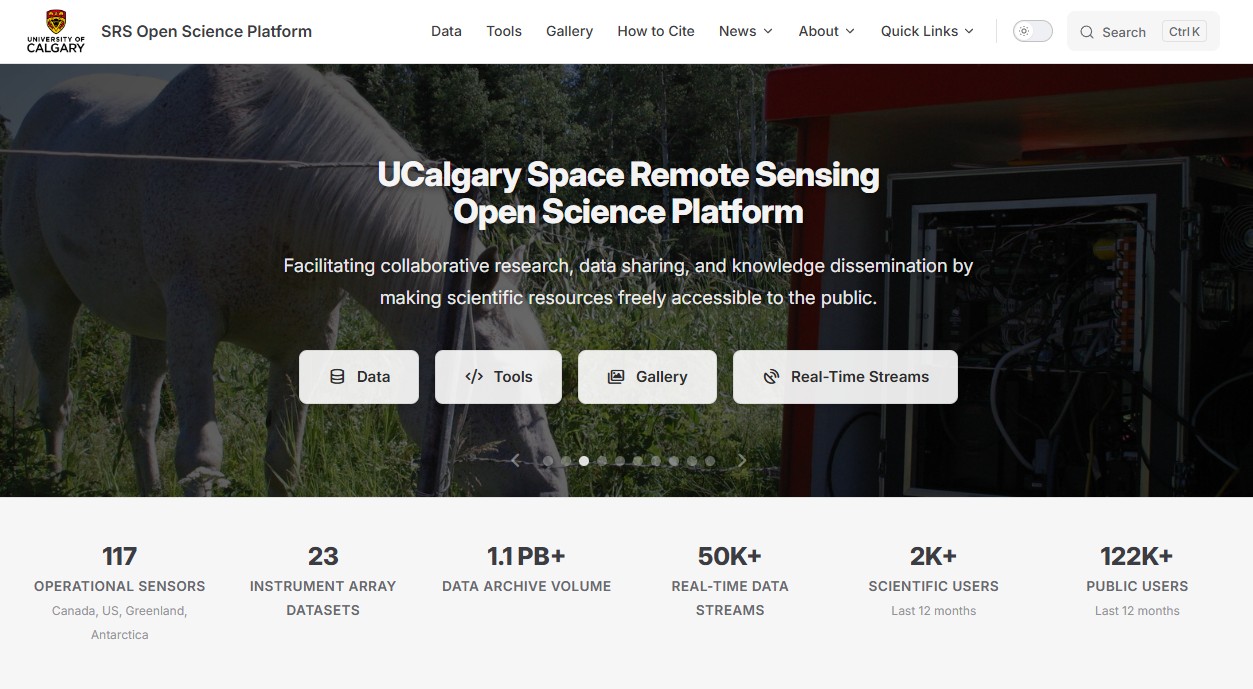
The homepage has been refreshed with a new layout. The news and bulletins section is now front and center right after the stats bar, making it easier to catch the latest updates. The following sections outline the main sections of the website, along with some higlighted figures show data volume and publications.
The homepage also now features an interactive real-time data globe that visualizes live data flowing in from our instruments. Watch RT stream data appear on a 3D globe as they arrive from our sensor networks. You can drag to rotate the globe and explore where the data is coming from.